I am still in the process of founding my own company, lambdaschmiede GmbH, currently struggling against the legendary and rampant bureaucracy in Germany. While bootstrapping the company with consulting, my mid-term goal is to provide and sell my own software products - and it should come as no surprise that I plan to create them with Clojure. This is a good reason for me to think about running, operating and monitoring Clojure web applications. One important topic for me is monitoring. How many requests hit the application per minute? Are there peaks? Which services consume the most time, which services response times were increased after the latest deployment? Which database calls are too slow?
This article is not meant to be a “How To” or “Best Practice” summary. It is just me writing things down as I experiment with the API to get some structure into my thoughts.
Also, I am aware that I have still lots of things to learn with Clojure, so a more experienced developer might write this code in a more elegant and idiomatic way.
Honeycomb
One of the solutions I am currently evaluating is honeycomb.io. I never used it to monitor a system in production, but I currently like the clear UI, the possibilities to configure the dashboards and the simple integration. The free tier can be used pretty extensively, and I also had two very pleasant experiences with them:
- After registering, I was asked per email what I was looking for and what I was planning to do with Honeycomb. I answered, that I was evaluating it for monitoring Clojure WebApps and did not expect them to come back to me - but soon I received an email pointing me to existing community-projects integrating Honeycomb with Clojure code. While I already was aware of those implementations, this made a good first impression with the support.
- While doing some load tests with a Spring Boot based Java application, I exceeded my usual traffic to Honeycomb by far. I received an email, that burst protection was enabled, meaning: The tracked data for that day was capped, protecting me from unexpected expenses or slipping into a more expensive tier.
Simply speaking, honeycomb.io provides a HTTP endpoint, which accepts events that our application sends asynchronously. These events support tracing and creating spans, meaning we could create a trace for a HTTP call to our application, and multiple spans for database calls, REST calls or other calls which are a part of this request, enabling us to see how long every part of the call took. The API is proprietary, an integration with OpenTelemetry exists. For this blog entry, I will use the proprietary “LibHoney” Java library and skip OpenTelemetry.
Goals and usecases
I have not rejected using one of the existing community integrations, yet, but I wanted to interact on a low level with the honeycomb.io API to understand the integration as well as possible, and, as the existing integrations are somewhat opinionated, make sure that I made up my own mind about the way I integrated the provider. My expectations for the integration were:
- Tracing of HTTP calls to a ring server:
- HTTP Status Code
- Error message in case of a 5xx status code
- Requested Route
- HTTP method
- Duration of the call
- Spans for SQL calls:
- Each as a span with the HTTP call being the parent
- Duration of the call
- Function name of the call
- SQL statement of the call (optional)
Preferrably, this should be achievable without introducing mutable state to track parent traces and spans. As I am not planning to publish another Clojure integration for honeycomb.io, the solution can be strongly opinionated to fit my usecases.
Setting up an application for testing
I chose to set up a (very) simplified web application with database access, which is close to the stack I use - ring, reitit and next.jdbc:
(ns honeycomb-mw.core
  (:require [ring.adapter.jetty :as jetty]
            [reitit.ring :as ring]
            [reitit.ring.middleware.muuntaja :as muuntaja]
            [muuntaja.core :as m]
            [next.jdbc :as jdbc]))

(def ds (jdbc/get-datasource {:dbtype "h2"
                              :dbname "example"}))

(comment
  (jdbc/execute! ds ["
create table name (
  id int auto_increment primary key,
  name varchar(32))"])

  (jdbc/execute! ds ["
insert into name(name)
  values('Tim'), ('Tom'), ('Marie'), ('Hanna')"]))

(defn get-names [datasource]
  (jdbc/execute! datasource ["select * from name"]))

(defn get-name-count [datasource]
  (jdbc/execute-one! datasource ["select count(*) as count from name"]))

(defn read-name-handler [request]
  (let [names-result (get-names ds)
        count-result (get-name-count ds)]
  {:status 200
   :body {:names names-result
          :count (:COUNT count-result)}}))

(def app
  (ring/ring-handler
    (ring/router
      ["/api"
       ["/names" {:get {:handler read-name-handler}}]]

      {:data {:muuntaja m/instance
              :middleware [muuntaja/format-response-middleware]}})))

(defn -main []
  (jetty/run-jetty #'app {:port 3000 :join? false}))
A short summary for readers who are not familiar with the libraries:
The datasource ds is created as soon as the namespace loads, it sets up a H2 in-memory database. The two calls to jdbc/execute! in the comment populate the schema with a table and data. They are commented out and can be called from the REPL on demand, as the H2 file is persisted as a file, and this action should not be called multiple times.
The function get-names returns all results from the table, get-name-count the number of names. Both are called from the handler function read-name-handler, which is connected to the route “/api/names” in the ring-handler setup (this does not make a lot of sense, but I wanted to SQL queries to test spans, later). The function -main in the bottom starts the server on port 3000.
Initializing LibHoney
Initializing an instance of HoneyClient is documented well, we just need to transfer the Java code to Clojure. create and options are static imports from io.honeycomb.libhoney.LibHoney:
create(
    options()
        .setWriteKey("myTeamWriteKey")
        .setDataset("Cluster Dataset")
        .setSampleRate(2)
        .build()
);
A little interop work leaves us with this function to create a client:
(import '(io.honeycomb.libhoney LibHoney))

(defn init-honeycomb [{:keys [write-key dataset sample-rate]}]
  {:client (LibHoney/create (->
                    (LibHoney/options)
                    (.setWriteKey write-key)
                    (.setDataset dataset)
                    (.setSampleRate sample-rate)
                    (.build)))})
Example for a function call to create and store the client:
(def honey (init-honeycomb {:write-key "<SECRET_KEY>"
           	               :dataset "clj-mw-test"
             		            :sample-rate 2}))
We can use this client to send an event. This function accepts the client and a map of values as a parameter:
(defn send-event [honey params]
  (-> (.createEvent honey)
      (.addFields params)
      (.setTimestamp (System/currentTimeMillis))
      (.send)))
Monitoring the HTTP calls to the server
I guess this will be the easiest part. All the data I want to transfer to honeycomb.io is available in the ring requests and responses. Let’s try and build a middleware, which wraps around the HTTP processing, tracks the time and sends the result to Honeycomb.
Middlewares are a way to plug your logic into the HTTP request chain of our server.
(defn honey-middleware [handler]
  (fn [request]
    (let [start-time (System/currentTimeMillis)
          response (handler request)
          duration (- (System/currentTimeMillis) start-time)]
      (send-event honey {"duration_ms" duration
                         "status" (:status response)
                         "method" (name (:request-method request))
                         "path" (:uri request)})
      response)))
This middleware can be included into our ring handler like this:
(def app
  (ring/ring-handler
    (ring/router
      ["/api"
       ["/names" {:get {:handler read-name-handler}}]]

      {:data {:muuntaja m/instance
              :middleware [honey-middleware
                           muuntaja/format-response-middleware]}})))
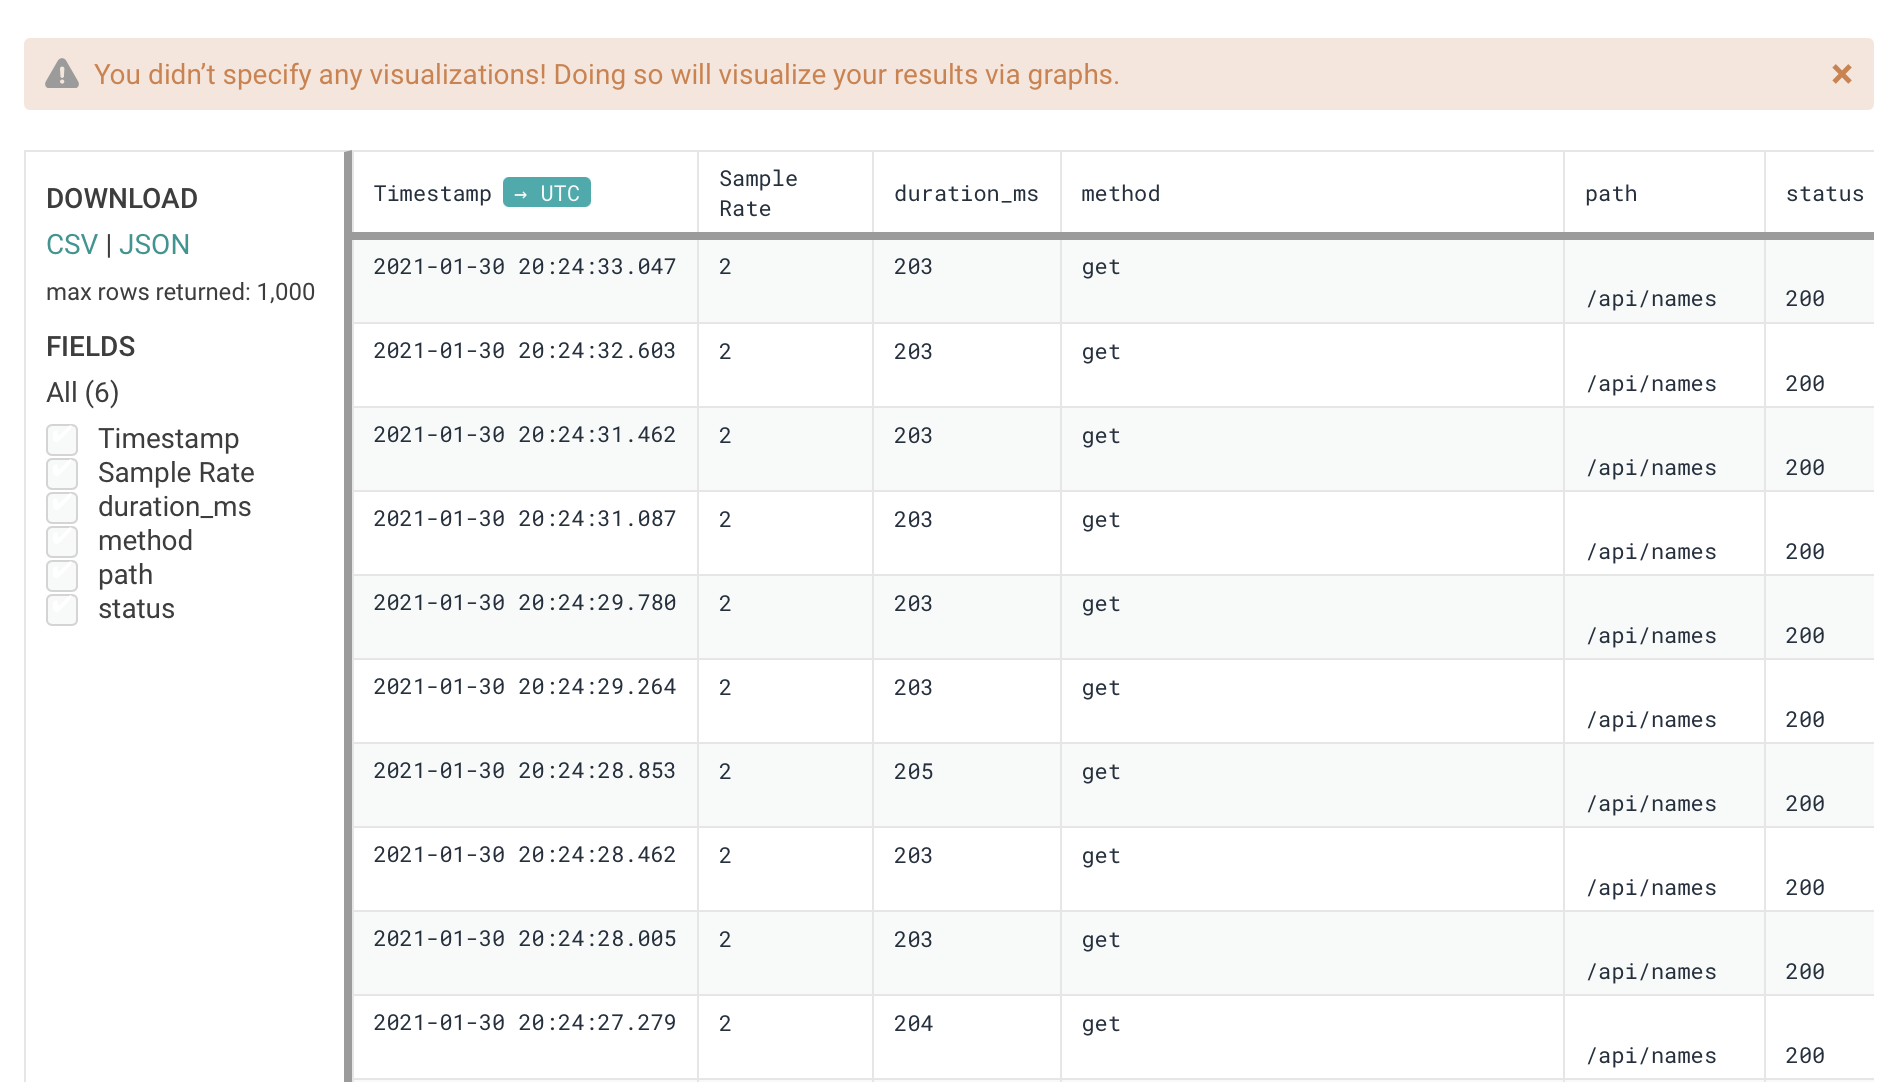
This function accepts the previous ring handler as a parameter and returns an anonymous function, which is responsible for processing the HTTP request and passing it on to the handler. As soon as the function is called, the current timestamp is stored in start-time. After doing so, the request is passed on, and the result is stored. The duration is calculated as the difference from the start-time and the current timestamp. Finally the event is sent to honeycomb.io, with all required attributes extracted from the request and response object into a parameter map. The response is then the return value of our function, as we only invoked side effects, and want to pass the response back into the HTTP chain. A quick look into our Honeycomb dashboard shows us, that the middleware works as expected:
Creating Traces and Spans
Parent Trace
Now the tricky part begins: We need to create a trace with multiple spans. For example, our HTTP call is the parent span and our database call is a child span - we need to build a hierarchy. Ideally, this can be achieved without storing spans globally and without sending the event from our JDBC function as well. The hierarchy can be transmitted to Honeycomb with these parameters, according to documentation:
| Field | Description |
|---|---|
| name | The specific call location (like a function or method name) |
| trace.span_id | A unique ID for each span |
| trace.parent_id | The ID of this span’s parent span, the call location the current span was called from |
| trace.trace_id | The ID of the trace this span belongs to |
| service_name | The name of the service that generated this span |
| duration_ms | How much time the span took, in milliseconds |
Let’s try and add these fields to our middleware, first:
(defn honey-middleware [handler]
  (fn [request]
    (print request)
    (let [start-time (System/currentTimeMillis)
          response (handler request)
          duration (- (System/currentTimeMillis) start-time)
          span-id (.toString (java.util.UUID/randomUUID))
          trace-id (.toString (java.util.UUID/randomUUID))]
      (send-event honey {"duration_ms" duration
                         "status" (:status response)
                         "method" (name (:request-method request))
                         "path" (:uri request)
                         "name" "honey-middleware"
                         "trace.span_id" span-id
                         "trace.trace_id" trace-id
                         "service_name" (:server-name request)})
      response)))
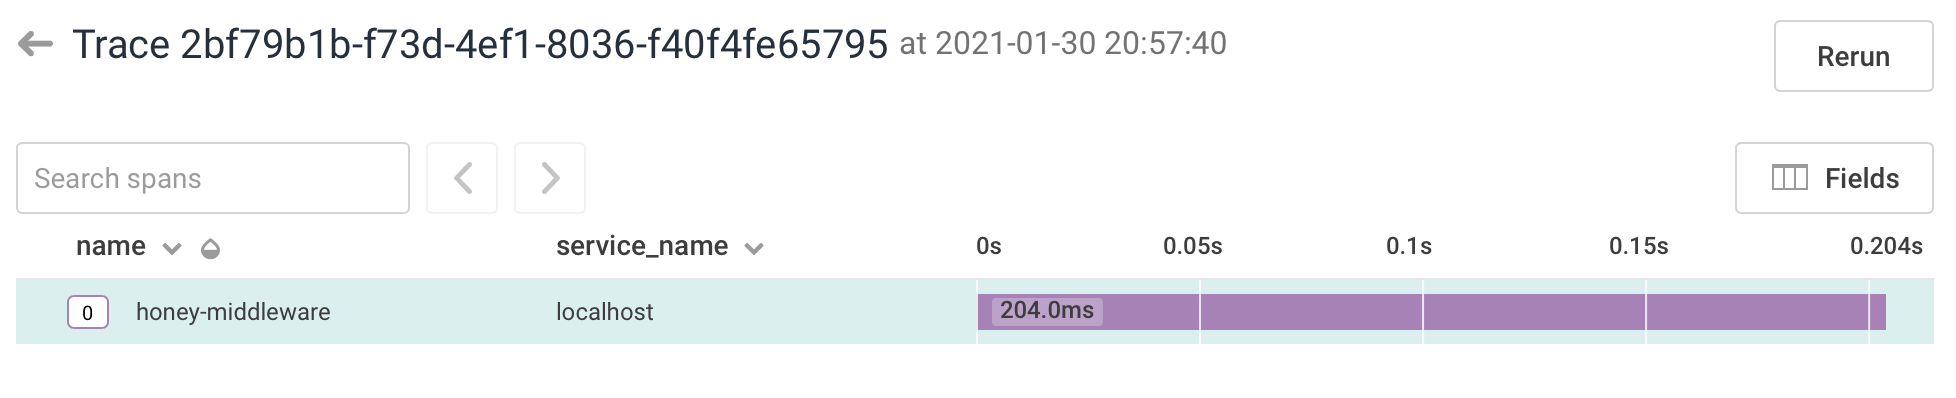
In the dashboard we can now see that the sent event was interpreted as a trace, but currently it just contains a single span:
A span for the handler
Before we try and create a span for both SQL calls, let’s try and create our first sub-span only one level deeper, in the read-name-handler. If we want to avoid calling honeycomb.io directly from the nested functions, we could try to utilize the middleware system. trace-id and span-id from the parent trace could be appended to the request, so the handlers in the deeper layers can access them. The resulting child-spans would then be appended to the response. In the end, the honey-middleware can collect and send them:
(defn read-name-handler [request]
  (let [honey-metadata (:honey request)
        start-time (System/currentTimeMillis)
        names-result (get-names ds)
        count-result (get-name-count ds)
        duration (- (System/currentTimeMillis) start-time)
        event {"duration_ms" duration
               "trace.span_id" (.toString (java.util.UUID/randomUUID))
               "trace.parent_id" (:span-id honey-metadata)
               "trace.trace_id" (:trace-id honey-metadata)
               "name" "read-name-handler"}]
    {:status 200
     :body {:names names-result
            :count (:COUNT count-result)}
     :honey (update-in honey-metadata [:children] conj event)}))

(defn honey-middleware [handler]
  (fn [request]
    (let [start-time (System/currentTimeMillis)
          span-id (.toString (java.util.UUID/randomUUID))
          trace-id (.toString (java.util.UUID/randomUUID))
          response (handler (assoc request :honey {:span-id span-id
                                                   :trace-id trace-id
                                                   :children []}))
          duration (- (System/currentTimeMillis) start-time)]

      ;; send the parent event
      (send-event honey {"duration_ms" duration
                         "status" (:status response)
                         "method" (name (:request-method request))
                         "path" (:uri request)
                         "name" "honey-middleware"
                         "trace.span_id" span-id
                         "trace.trace_id" trace-id
                         "service_name" (:server-name request)})

	   ;; send events for all child spans
      (dorun (map #(send-event honey %) (get-in response [:honey :children])))
      response)))
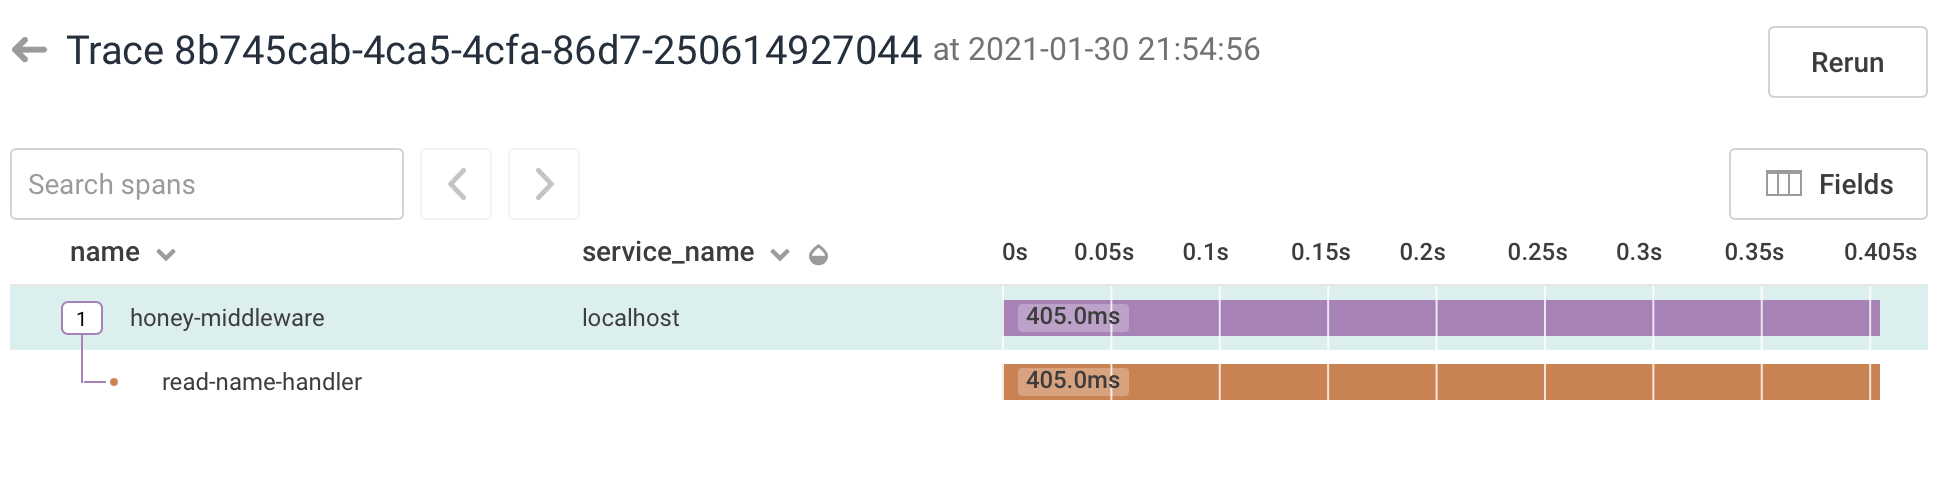
This is annoyingly verbose and mixes the query logic with tracing - but it’s a work in progress, first we need to check if we like the idea, at all. At least it seems to work. We can now see the child span. As expected, doing this for the handler does not add any useful information at all:
Let’s try and add the same logic to the SQL functions instead:
(defn get-names [datasource honey-metadata]
  (let [start-time (System/currentTimeMillis)
        result (jdbc/execute! datasource ["select * from name"])
        duration (- (System/currentTimeMillis) start-time)
        event {"Timestamp" start-time
               "duration_ms" duration
               "trace.span_id" (.toString (java.util.UUID/randomUUID))
               "trace.parent_id" (:span-id honey-metadata)
               "trace.trace_id" (:trace-id honey-metadata)
               "name" "get-names"}]
    {:result result
     :honey event}))

(defn get-name-count [datasource honey-metadata]
  (let [start-time (System/currentTimeMillis)
        result (jdbc/execute! datasource ["select count(*) as count from name"])
        duration (- (System/currentTimeMillis) start-time)
        event {"Timestamp" start-time
               "duration_ms" duration
               "trace.span_id" (.toString (java.util.UUID/randomUUID))
               "trace.parent_id" (:span-id honey-metadata)
               "trace.trace_id" (:trace-id honey-metadata)
               "name" "get-name-count"}]
    {:result result
     :honey event}))

(defn read-name-handler [request]
  (let [honey-metadata (:honey request)
        names-result (get-names ds honey-metadata)
        count-result (get-name-count ds honey-metadata)
        events [(:honey names-result)
                (:honey count-result)]]
    {:status 200
     :body {:names (:result names-result)
            :count (:result (:COUNT count-result))}
     :honey (update-in honey-metadata [:children] concat events)}))
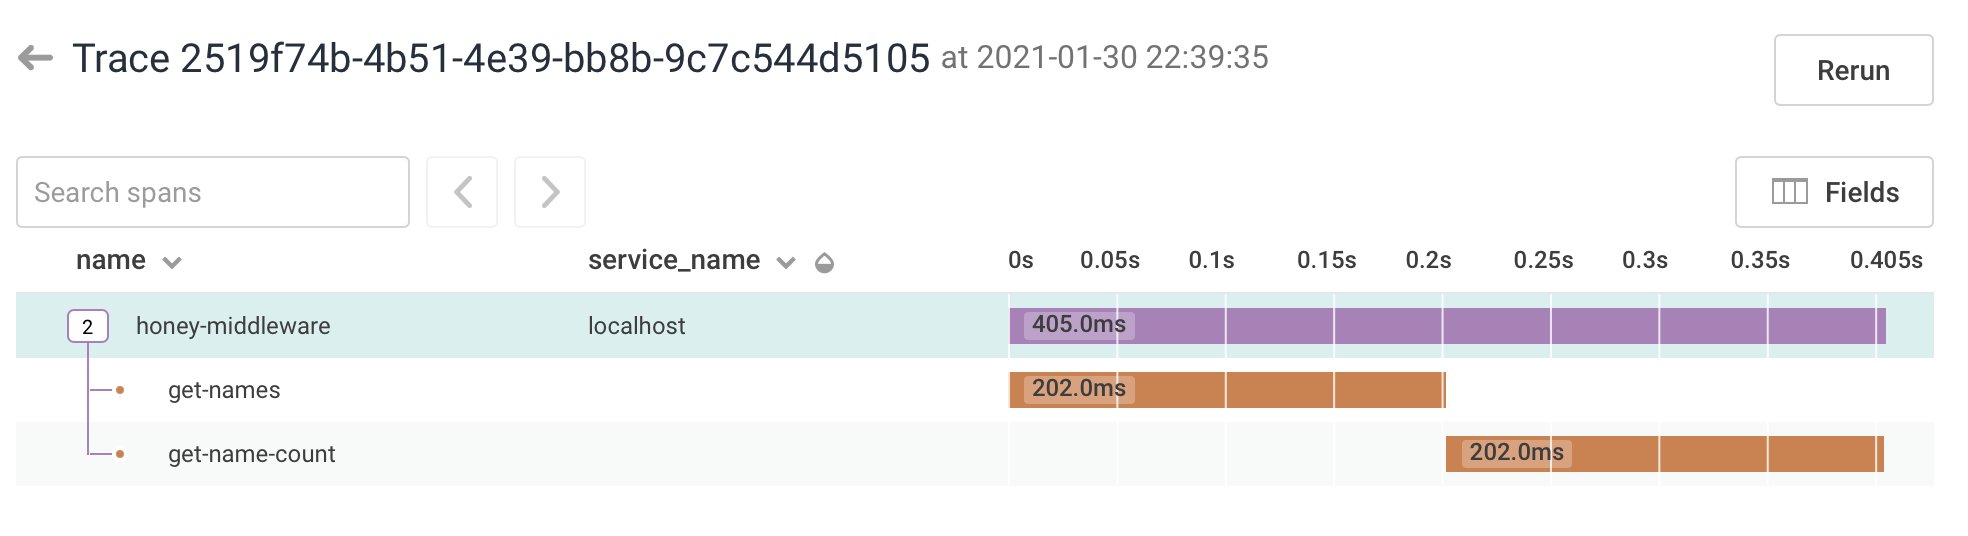
This is looking even more cluttered. In order to hand back the trace event, the return value of the functions needs to be widened. Also, we need to add the Timestamp attribute manually now, because else the sending timestamp would be considered by honeycomb, not the creating timestamp. The SQL functions now have 12 lines of code, with 1(!) of those lines doing “real” appliction logic, and the other ones only tracing. It would be nice to add some abstraction. At least, our trace in Honeycomb is coming along nicely:
Trying to find a common pattern
As already pointed out, there is a huge amount of overhead in our subtraced functions - and this overhead looks very similar. We can create a traced function, which accepts the “real” application logic as a function parameter:
(defn traced [f honey-metadata]
  (let [start-time (System/currentTimeMillis)
        result (f)
        duration (- (System/currentTimeMillis) start-time)
        event {"Timestamp" start-time
               "duration_ms" duration
               "trace.span_id" (.toString (java.util.UUID/randomUUID))
               "trace.parent_id" (:span-id honey-metadata)
               "trace.trace_id" (:trace-id honey-metadata)
               "name" "get-names"}]
    {:result result
     :honey event}))

(defn get-names [datasource honey-metadata]
  (traced #(jdbc/execute! datasource ["select * from name"])
          honey-metadata))

(defn get-name-count [datasource honey-metadata]
  (traced #(jdbc/execute! datasource ["select count(*) as count from name"])
          honey-metadata))
This looks a lot nicer and cleaner. We still pass the honey-metadata through our whole application, and we still need it in the functions return values, but this cannot be helped, if we don’t want to add the events to some kind of global state. One thing that’s left to do is to add another parameter to traced, so it can accept the function name again, and we can start tracing more and more functions in a span. The functions honey-middleware and traced are reusable and can be moved into a separate namespace. This leaves us with relatively small amounts of code to manage the tracing itself:
(ns honeycomb-mw.core
  (:require [ring.adapter.jetty :as jetty]
            [reitit.ring :as ring]
            [reitit.ring.middleware.muuntaja :as muuntaja]
            [muuntaja.core :as m]
            [next.jdbc :as jdbc]
            [honeycomb-mw.honey :refer [traced honey-middleware]]))

(def ds (jdbc/get-datasource {:dbtype "h2"
                              :dbname "example"}))

(defn get-names [datasource honey-metadata]
  (traced #(jdbc/execute! datasource ["select * from name"])
          honey-metadata
          "get-names"))

(defn get-name-count [datasource honey-metadata]
  (traced #(jdbc/execute! datasource ["select count(*) as count from name"])
          honey-metadata
          "get-name-count"))

(defn read-name-handler [request]
  (let [honey-metadata (:honey request)
        names-result (get-names ds honey-metadata)
        count-result (get-name-count ds honey-metadata)
        events [(:honey names-result)
                (:honey count-result)]]
    {:status 200
     :body {:names (:result names-result)
            :count (:result (:COUNT count-result))}
     :honey (update-in honey-metadata [:children] concat events)}))

(def app
  (ring/ring-handler
    (ring/router
      ["/api"
       ["/names" {:get {:handler read-name-handler}}]]

      {:data {:muuntaja m/instance
              :middleware [honey-middleware
                           muuntaja/format-response-middleware]}})))

(defn -main []
  (jetty/run-jetty #'app {:port 3000 :join? false}))
Summary
For the first experiments I am quite happy with the results. If it was only for tracing the HTTP requests, it would only be a matter of adding the middleware. For sub-spans, there is some limitation to how the functions have to be structured, and I will have to wait and see how much it bothers me. In contrast to Spring Boot in the Java world, where you just register the Honeycomb starter and the whole application is instrumented automagically, this is a lot more work, and the tracing is far more visible in the code. Also, I need to put some additional work in to customize the trace information, e.g. if I want to trace a REST call the server is doing and add the response codes there to the event. Nevertheless, I feel like having a good starting point that enables me to use honeycomb.io as an APM tool for Clojure.